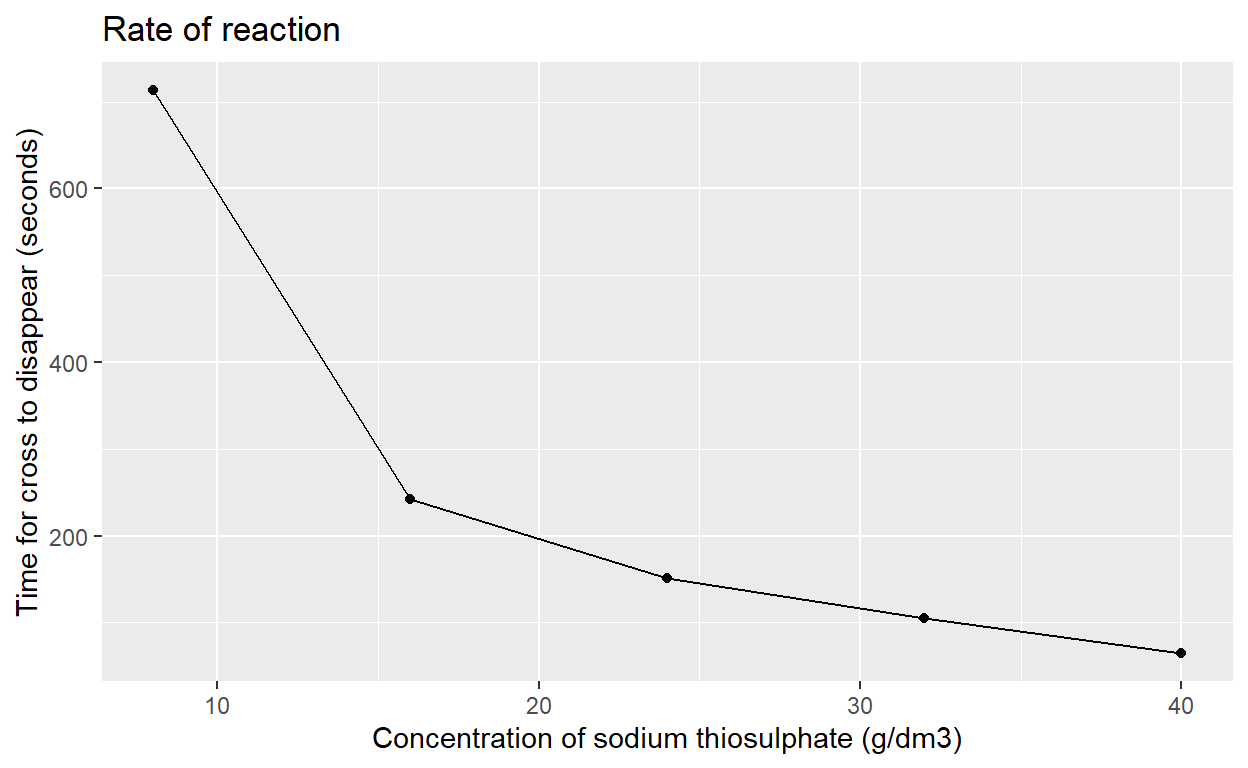
Rate of reaction chemistry practical - monitoring a change in turbidity
The lesson starts with a worked example to introduce the R code needed to draw a graph of the mean time for the cross to disappear against the concentratrion of sodium thiosulphate and then allows the student to reproduce the graph using their own data