GCSE: Chemistry Practical: Rates of Reaction Part 2 Observing a colour change
Lesson objectives
To draw a graph in R of mean time for cross to disappear against concentration of sodium thiosulphate
To use the graph to interpret your results
Packages used in this lesson:
tidyverse
Success criteria
I can use R to calculate means
I can plot a line graph using R code
Keywords
- mean rate of reaction
- geom_point
- geom_line
- ylab
- xlab
- ggtitle
Worked Example
This is a worked example for you to follow.
This is how to calculate the mean time taken for the cross to disappear in seconds for each concentration of sodium thiosulphate.
R is being told that when the concentration is 8 g/dm3, the times in each experiment for the cross to disappear in seconds was 810,545, 756, 720, 736. R stores these times in a variable called c8 and then finds the mean of the times in c8. This is repeated for each concentration of sodium thiosulphate used.
Click on the little arrow on the left of the code chunk to run the code. Check R has calculated the means.
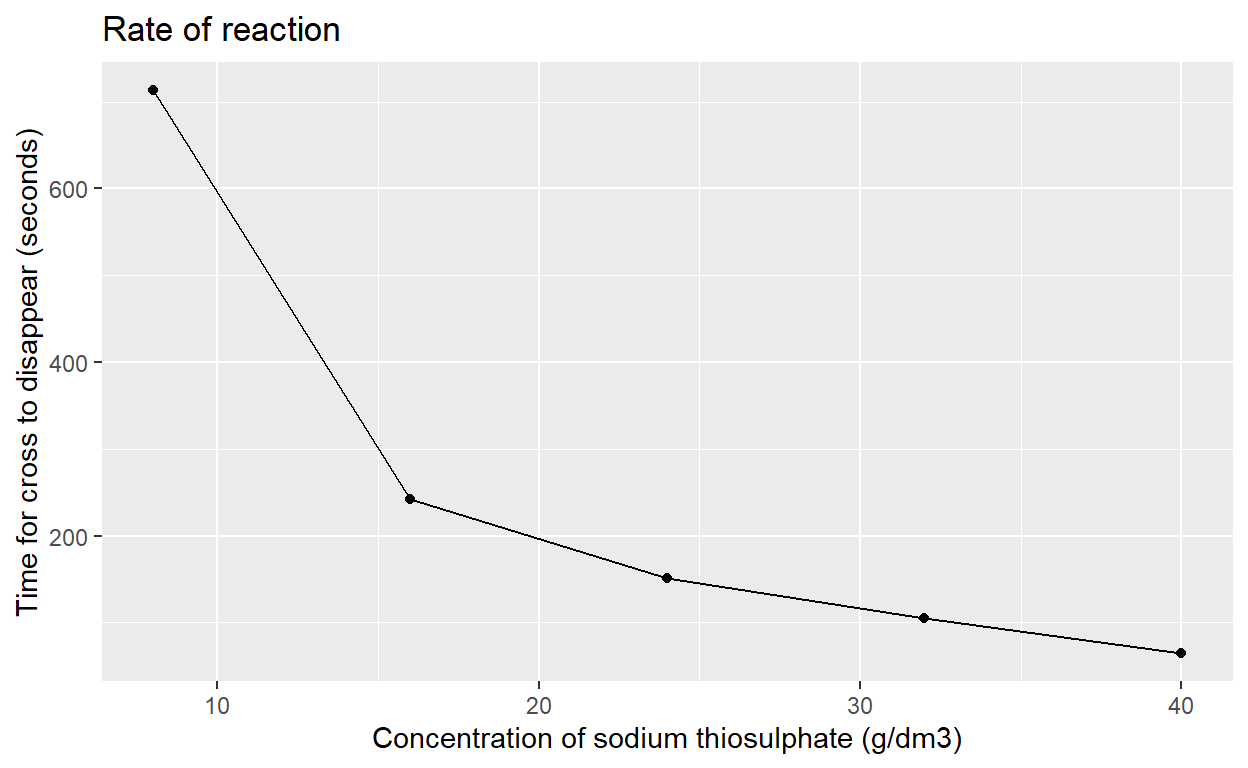
[1] 713.4[1] 242.4[1] 151.5[1] 105[1] 64.5Now we will plot a graph of the mean times calculated above for the cross to disappear (in seconds) against concentration of sodium thiosulfate (g/dm^3)
The code in chunk2 tells R to use the concentrations on the x axis and the mean times on the y axis. Draw a table (called mydata) with the values of x and y in and then plot the points on a graph, draw a line between the points and label the x and y axis. Finally give the graph a title.
Click on the little arrow on the right of the code chunk. Has R produced a graph? Knit your document and check the output file.
x <- c(8,16,24,32,40)
y <- c(mean(c8), mean(c16), mean(c24), mean(c32), mean(c40))

mydata <- tibble(x, y)

ggplot (mydata, aes(x,y)) +
  geom_point () +
  geom_line() +
  ylab ("Time for cross to disappear (seconds)") +
  xlab ("Concentration of sodium thiosulphate (g/dm3)") +
  ggtitle ("Rate of reaction")
Activity:
Now you are going to plot a graph using the data that you collected from your experiment.
First calculate the mean time taken for the cross to disappear for each concentration of sodium thiosulphate.
Use code chunk1 from the example above to help you but remember to replace the example times with your own data.
Run your code to check the means.
Now using the calculated means, plot a graph of mean time taken for cross to disappear (in seconds)on the y axis and concentration of sodium thiosulphate (g/dm^3) on the x axis. Use code chunk2 from the example above to help you.
Answer the following questions
Q1 Describe how concentration affects the rate of reactionQ2 Explain your answer to Q1 by referring to the shape of your graphQ3 If the rate of reaction doubled, what would happen to the time taken for the cross to disappearQ4 Describe a possible source of errorQ5 Suggest a way of reducing the errorQ6 How do you use R to calculate the mean?Q7 How do you use R to write the title?Write your answers below
NOW KNIT THE DOCUMENT for the final time. This is the version of your work that your teacher will mark.
THE END
License and Citation: You can use, modify, and adapt any of the lessons, but please include the following attribution: RGirls Community. (2022, April 10). RGirls Lessons. Zenodo. https://doi.org/10.5281/zenodo.6436861